
15 July 2021 · 9 min read
Track your sales performance effectively: discover the 7 must-have sales KPIs, with clear definitions and calculation methods for your sales dashboard.

Every company that wants to grow sets sales targets. That is why they then rely on performance indicators to assess their progress.
In this context, sales performance indicators play a special role. They are closely linked to the company's revenue and growth, so you need to choose them with particular care.
Your sales indicators are part of your business dashboards (management reporting). They contribute significantly to managing your company's performance.
To help you choose your sales indicators, we will answer the following questions.
- What is a sales performance indicator?
- What are the 7 essential sales indicators?
- How do you build your sales dashboard?
The term performance indicator is often used interchangeably with KPI (Key Performance Indicator). In this article, we will use both terms.
 🚀 Are you a start-up or scale-up?
💡 By tracking KPIs, you get a clear view of your current performance so you can set even more ambitious goals!
In this exclusive ebook, discover the KPIs to track to drive your growth.

What is a sales performance indicator?
Sales performance indicators are one category of business key performance indicators. There are others, such as financial, marketing, HR or project management KPIs, to name just a few.
Whatever its type, a performance indicator assesses whether an objective is being met. It allows you to:
- steer and measure the effectiveness of the actions taken;
- and track the company's activity at different levels.
How do you find the right sales performance indicator?
There are many sales KPIs, but not all of them will suit your needs. To choose your indicators wisely, rely on your company's strategy.
In general, focus your efforts on a small number of well-targeted sales indicators.
To help you choose, we have selected a list of particularly useful indicators.

7 essential sales KPIs
Let's get to the heart of the matter! Here are the 7 sales indicators we have selected for you:
- revenue;
- number of leads;
- conversion rate;
- average purchase amount per customer;
- reasons why customers decline or sign;
- average sales cycle length;
- weighted pipeline value.
7 mistakes to avoid for successful reporting
❌ Every finance professional has made a reporting mistake at some point. Drawing on our 10,000+ client companies, we have gathered the most common mistakes for you.
✅ Never make a mistake again by downloading this free ebook.

Revenue
Revenue is the total amount of a company's sales of products and services. This indicator is analyzed over a given period.
Here is how to calculate it:

Revenue is one of the first sales KPIs to analyze.
This indicator is used to:
- build a forecast;
- track a company's sales performance;
- estimate a company's value.
This sales performance indicator can be analyzed according to the company's needs, that is, over a period of:
- a day;
- a week;
- a month;
- a quarter;
- a half-year;
- or a year.
The period you choose should be based, for example, on the seasonality of your company's products and services.
How can you stop racing against the clock as a CFO? 🤔
⏰ Discover 4 time-saving levers for CFOs in a free ebook.

Number of leads
To be profitable, a company looks to win new customers. In a sales context, a potential new customer is a lead. A lead is a contact who may be interested in a service or product. Lead generation is the process put in place to create qualified contacts.
Here is how to calculate lead volume:

It is important to measure how the number of leads generated evolves, but also where those leads come from. We recommend tracking the number of new leads on a regular time basis (every month, for example).
The definition of a lead can vary from one company to another. It is therefore important to agree on a definition of a lead internally from the start.
Conversion rate
This is the ratio between the number of users who took an action and the total number of users. In a sales context, companies are mostly interested in converting leads into customers.
It is calculated as follows:

The sales process aims to improve the conversion of your leads into new customers.
What matters to you from a sales perspective is knowing how leads are converted into customers. If your conversion rate is high, that is a good sign: you are generating high-potential leads.
Average purchase amount per customer
Increasing customers' average purchase amount is generally one of the main goals of sales departments.
To understand how to assess this indicator, we have brought together 2 main KPIs:
Depending on your business model and industry, one of these two KPIs will let you track the average purchase amount.
Download our free ebook: "How to build a dashboard" 📈

Average basket
The average basket is the average amount a customer spends in a store or online. This KPI is therefore closely tracked in the retail sector, for example.
Here is how to calculate it:

Depending on your goals and needs, you can run this calculation over:
- a day;
- a week;
- a month;
- a quarter;
- or a year.
We suggest analyzing this KPI throughout the year and paying even closer attention to it during your peak periods (that is, when your customers spend the most).
You probably noticed it with the average basket calculation: average basket and revenue are linked. Assuming the number of purchases stays constant, an increase in the average basket will increase your revenue.
This explains, for example, the importance of cross-selling or up-selling placed at strategic points in your stores (offline or online).
Average ACV
ACV stands for Annual Contract Value. This KPI is mainly tracked by SaaS companies with a subscription model. It is the average annual value of subscription contracts. Take the example of a customer who signs a 5-year contract for 10,000 euros. Such a contract corresponds to an average ACV of 2,000 euros.
ACV can be calculated as follows:

Tracking ACV helps you monitor and understand your revenue. If you find that your ACV is low, it may mean you need more customers.
It is therefore worth calculating your customers' average ACV to get a view of the average amount your customers spend.
What counts as a "low" ACV varies widely from one industry or business model to another. The way ACV is calculated can also vary from one company to another. A low ACV is not a negative in itself. Netflix, for example, generates a limited ACV (€143.88 per year based on a €11.99 subscription). Yet the company is still a leading player in its market.
ACV only becomes fully meaningful when combined with other KPIs. For example, it is useful to analyze it alongside:
- churn (attrition or cancellation rate);
- or CAC (customer acquisition cost).
Analyzing ACV and CAC lets you estimate, for example, how long it will take for a product or service to become profitable.
Reasons why customers decline or sign
The aim here is to identify the most common reasons for declining or signing a contract. This topic deserves your full attention, because it affects your conversion process. Make sure you identify these reasons and then take them into account in your sales pitch.
You can calculate the share that each reason for declining or signing represents.


Track the reasons prospects sign as closely as the reasons they decline. Take the example of two competing companies. One offers a service, the other does not. The absence of that service may cause the second company to lose sales opportunities. If the company that doesn't sell the service sees that this is hurting it, a change may be needed. In this scenario, a reason for not signing has led to an opportunity to improve the offering itself.
To make life easier for your sales teams, define a list of standard reasons. Some may relate to your company, others to the prospect's objections. Examples of reasons for declining include:
- price too high;
- missing feature(s);
- chose a competitor;
- …
Average sales cycle length
The average sales cycle length is the average time between the moment a prospect is qualified and the signature.
Here is an example of a sales cycle diagram:
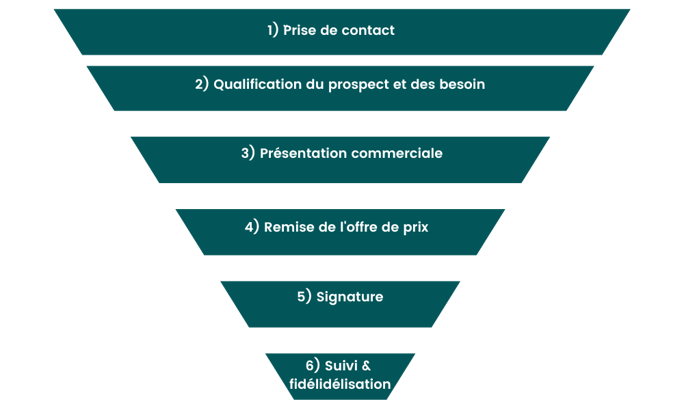
Here is how to calculate this metric:
Average sales cycle length is an essential sales indicator. It is used to forecast sales performance and steer activity. The length of the sales cycle can vary depending on several factors.
- The type of product or service:
The commitment the sale represents (in particular the length or price of the license).
- The type of audience targeted:
Sales cycles get longer as the number of stakeholders involved increases.
- The experience of the sales reps:
How they present the offer, how they handle objections, how they close the deal, …
We recommend analyzing your sales cycle by product, service or region. This will help you identify the most effective sales techniques.
Weighted pipeline value
This is the value of open sales opportunities, taking into account the probability of closing. This indicator provides information on the company's future revenue. It shows whether a sales team can reach its sales targets.
The sales pipeline lets you visualize the different stages of the sales cycle.
It is calculated as follows:

It is important to assess how relevant your signature probabilities are. To do so, compare the weighted pipeline value (at a given time T) with the value of signed customers (for period T, once the average sales cycle length has passed). The closer these values are, the more accurate your forecasts.

How to build your sales dashboard
Set your business strategy first
Every company needs to develop a strategic plan. This is the step that comes before building your sales dashboards.
Your business strategy defines the direction of your company. It then involves setting objectives aimed at achieving results.
Define the objectives to reach
Selecting your performance objectives is a key step in designing a dashboard. Your KPIs flow from your objectives, so these must be particularly well defined.
Your dashboard will be all the more relevant and actionable if it is based on clear, precise objectives.
Select and track KPIs based on your objectives
Once your objectives are set, select and track the sales KPIs that are most relevant to your business strategy and your sales strategy. It is important to analyze how these KPIs evolve in order to assess whether the objectives are being met.
Build effective sales reporting
Sales reporting worthy of the name needs to be well prepared and use the right indicators.
Reporting helps you understand your company in detail and base your decisions on facts. Reliable reporting lets you centralize your performance indicators. Well-designed dashboards allow you to:
- anticipate how your business will evolve;
- and speed up your decision-making.
To hit the mark, use a small number of KPIs that are consistent with your strategy. Your goal is to give your users just the right amount of information.
To help you assess how effective your sales reporting is, here is a selection of points to watch:
- structure your dashboards and stay consistent with your business strategy;
- build your dashboards around your company's objectives;
- identify the sales performance KPIs suited to your objectives;
- update your dashboards regularly;
- present your information in a relevant way;
- offer different formats, tailored to the users of your reporting (based on their needs, responsibilities and usage).

You're on the right track with these 7 KPIs
Selecting sales performance indicators is an exercise in itself.
You now have a solid foundation to define your sales indicators and make your reporting a success!




Rather talk it through with a human?
A first conversation, with no commitment, to see what your reporting could become.