
5 August 2021 · 9 min read
Where should a CEO start when running a financial analysis? Our answers on the key financial ratios to track and the right method to follow for clear insights.

Have you ever tried on someone else's glasses? If so, you already know: to see clearly, everyone needs their own lenses!
The same goes for financial analysis. CEO, CFO, department head, investor... Everyone looks at a company's finances from a specific angle. In other words, the Chief Financial Officer and the Chief Executive Officer see the company's finances very differently. Where a CFO focuses on the details, the CEO favors the big picture.
It is precisely the CEO's big-picture view that we chose to focus on in this article. We have gathered our best financial analysis advice for you. Here is what we cover:
- definitions and fundamentals of a company's financial analysis;
- how to conduct the financial analysis of your company using the ratio method;
- 7 financial ratios every CEO should know and track.

Definitions and fundamentals of financial analysis
Financial analysis is the methodical assessment of a company's financial position. It gives business leaders a concise, fact-based view of their organization's financial health.
Financial analysis is one of the tools used to assess an organization's financial and operational performance. As such, it is mainly useful to three groups.- The company's CEO, who gets a diagnosis of the company's performance and health.
- Shareholders, who get a clearer view of the company's profitability.
- Creditors (banks and/or suppliers), investors and/or shareholders, who find information on the company's solvency and liquidity in the conclusions of the analysis.
 Note that department managers may also be interested in this kind of information.
- Financial structure.
- Assets.
- Operating cycle.
- Activity/revenue.
- Profitability.
The 6 steps of a financial analysis:
It is generally accepted that a financial analysis is carried out in 6 steps.- Study the company's environment (industry study, market study, etc.).
- Gather the accounting documents needed for the analysis.
- Assess how the company has evolved (the past).
- Assess the company's current situation (the present).
- Recommend the changes to make (decisions).
- Gauge the (future) impact of these changes to improve the company's performance management.
Methods for a company's financial analysis
There are several methods for analyzing your company's finances.- Analysis of the balance sheet structure.
- Vertical analysis, focused on how the balance sheet structure changes over time.
- Horizontal analysis, centered on how the various balance sheet line items change over time.
- Analysis by ratios, focused on analyzing balance sheet structure ratios.
To best address your challenges as a business leader, we recommend the last method. The ratio method is a good way to get an actionable view of your company's financial health.

Analyzing your company's finances with the ratio method
Best practices for ratio-based financial analysis
To get the most out of your company's financial analysis:- select a small number of meaningful financial ratios;
- analyze several ratios together (and compare your ratios with those of previous fiscal years and/or your industry).
- another year;
- other departments;
- market standards (for example).
The four must-know types of ratios
Financial ratios are commonly grouped into 4 categories:- activity ratios;
- liquidity ratios;
- solvency ratios;
- profitability ratios.
Activity ratios
These ratios focus on the overall view of the company. They include ratios such as revenue and personnel expenses.
Definition and calculation:The growth rate is also a useful ratio to track. It is versatile and applies just as well to revenue as to EBITDA or gross margin growth.
Here is how to calculate it:

The growth rate is usually calculated on revenue. If your company has a positive EBITDA, we recommend tracking the growth rates of your EBITDA and gross margin. If your company is not profitable, however, calculate the revenue growth rate instead.
Liquidity ratios
These ratios are dedicated to the efficiency of the company's cash. They include WCR (working capital requirement) and net cash position.
Definition and calculation: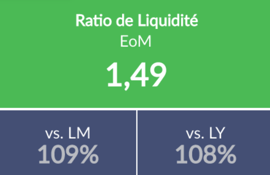
A liquidity ratio screen in the EMASPHERE platform
The current ratio (current ratio, or liquidity ratio in the broad sense) is also worth tracking.
It is calculated as follows:

In addition to the current ratio, there are several other liquidity ratios.- The restricted liquidity ratio (acid test ratio).
- The immediate liquidity ratio (quick ratio).

Track your financial analysis ratios efficiently: adopt actionable reporting that is quick to set up. Download our ebook on building dashboards now.

Solvency ratios
These ratios focus on the company's ability to repay its debts. Two of the most iconic ratios are (unsurprisingly) the solvency and debt repayment capacity ratios.
Definition and calculation:They are complemented by tracking ROE (Return On Equity). We cover this indicator in detail a little further down.
Profitability ratios
As their name suggests, these ratios are geared toward assessing the company's financial performance. EBITDA and gross margin are two financial ratios that are inseparable from this category.
Definition and calculation:To round out your profitability tracking, you can rely on the return on equity ratio. It is especially useful to capital providers (investment funds, partners, etc.) for tracking the company's financial profitability. It is calculated as follows:

If this ratio is above 5%, you can consider your company's financial profitability satisfactory.

The 7 essential ratios for a CEO's financial analysis
This section is for business leaders who want to focus on what matters most. Here is our selection of 7 simple, meaningful and versatile indicators:
- EBITDA (Earnings Before Interest, Taxes, Depreciation, and Amortization);
- ROI (Return On Investment);
- ROS (Return on Sales);
- ROA (Return on Assets);
- ROE (Return on Equity);
- ROCE (Return on Capital Employed, i.e. invested/employed capital);
- ROO ( Return on Operations).
This selection includes ratios that are frequently tracked by our 10,000+ customer companies. Many of them are mature businesses with multiple entities to consolidate. That is why some of these indicators may not apply to your company if it is younger.
EBITDA
EBITDA stands for earnings before interest, taxes, depreciation and amortization. It is a close relative of gross operating profit.
EBITDA provides insight into the company's profitability. It is calculated as shown below:

EBITDA assesses the profitability of your company's operating process. This indicator reveals the wealth your company creates. In particular, it lets you compare your company with its competitors.
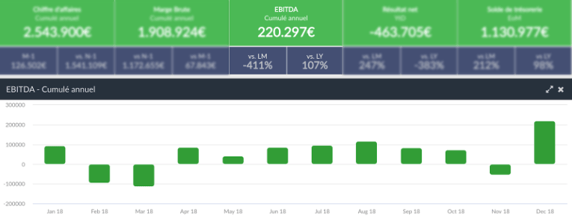
An EBITDA tracking screen in EMASPHERE.
EBITDA does not take into account: - your investment or financing policies;
- your tax constraints.
ROI
Return on investment represents the profit generated for every €1 invested. It is expressed as a %. If an investment is profitable, this ratio is positive.

An ROI indicator in EMASPHERE
Here is how to calculate it:

An investment is considered profitable when it generates income (in the shorter or longer term). ROI assesses the investment's performance. Logically, the larger and more accessible the short-term capital gain opportunities, the more your company will attract potential investors.
ROS
ROS measures the efficiency and profitability of commercial companies after all costs are taken into account. This indicator compares operating profit with revenue.
Here is how it is calculated:

ROS lets you estimate the percentage of sales converted into profit.
Return on sales and net profit margin are two very similar financial indicators. It is commonly accepted that these two figures are interchangeable. A positive ROS (or net profit margin) means your company is profitable. A negative ROS indicates that it is making losses.
ROA
ROA focuses on the rate of return on invested assets. It shows whether the company's resources are being used well. In other words, whether they help generate profit.
This ratio is based on:- net margin (the company's bottom-line profitability);
- and asset turnover (a ratio obtained by dividing total revenue by assets, to calculate the profitability of each asset).
Return on Assets helps determine whether the company is making a profit or a loss. It also assesses total assets (that is, all the items that generate resources).
It expresses a company's ability to generate income from its resources.
Here is the most commonly used method for calculating ROA:

An ROA below 5 is generally considered low. It indicates that the company's profitability is insufficient compared to its physical and financial resources.
ROE
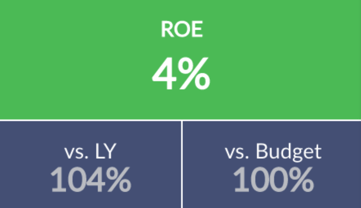
The ROE indicator in the EMASPHERE platform
ROE is the ratio between net income and equity. It calculates the financial return on equity. It allows a company's shareholders to measure the return on the equity capital they have invested.
Return on Equity is closely followed by financial analysts. They rely on this indicator to compare the financial profitability of companies in the same industry.
Its calculation is shown below:

ROE and ROA are two indicators that are often analyzed side by side. Unlike ROA, ROE takes debt into account.
When these 2 indicators do not move in the same direction, you need to be careful. For example, a low ROA and a high ROE can indicate that profit is being generated through high debt (in the absence of sufficient return on assets).
If your ROA and ROE are both stable over time, analysts consider your company to be stable.
ROCE
ROCE helps identify undercapitalized companies that rely on excessive leverage (relying on debt rather than on their equity). It is tracked as closely by capital providers as by the company's own teams.
From a business management standpoint, this indicator ensures that the capital made available to the company is used to finance its investments and working capital requirement.
Return on capital (employed/invested capital) takes all sources of financing into account, including debt.
Here is how to calculate it:

ROCE is sometimes used alongside ROE. Unlike Return On Equity, it takes into account the risks the company takes on. It is one of the decision criteria for potential investors. There is no absolute benchmark for ROCE. Every industry and business model has its own capital needs.
ROO
ROO is a derivative of ROCE for private companies. It is a powerful indicator for measuring a company's commercial success.
Unlike ROCE, ROO has the advantage of quantifying all of the following:- past operating returns;
- the company's value creation;
- the company's reach compared to that of its competitors.
Here is how to calculate it:

An acceptable ROO level is not determined by your industry or the size of your company. An acceptable ROO level is determined by the risk profile the company faces.

What to do after your financial analysis?
By now, financial analysis should be much clearer to you. As you have seen, financial analysis is an opportunity to take an informed look at the health of your company's finances.
As someone who runs a company, you will find this financial analysis especially useful. It gives you the opportunity to make informed strategic and investment decisions.
That is why accessing the results of this actionable analysis should be quick and simple. To meet this need for efficient performance management, the EMASPHERE platform can help:
- its catalog of 50+ financial KPIs lets you create your own indicators,
- its drill-down feature lets you dig into the detail of your figures all the way to their source,
- you set your own alerts to be notified as soon as a threshold is reached;
- access to information is made easier with reports and access rights tailored to each user (level of responsibility, user needs, etc.).

Never miss the metrics that matter most to your company: track the most meaningful CEO KPIs. Download our dedicated ebook and choose from our selection of KPIs related to:
- sales;
- purchasing, personnel and overhead;
- finance;
- HR;
- marketing.





Rather talk it through with a human?
A first conversation, with no commitment, to see what your reporting could become.