
8 July 2021 · 10 min read
Everything about financial ratios: definitions, formulas, tips and recommendations based on the practices of our 10,000+ customer companies. Read more.

Choosing your financial ratios is a bit like adjusting the range of your binoculars. You need to find the right setting to see further or closer, in more or less detail, into your company's finances. You need to find the right ratio to observe the metrics that contribute to your company's health.
To give you a clearer picture of financial ratios, we've covered everything. We'll look at:

Understanding the concept of financial ratios
Financial ratios: definition and uses
In finance, ratios are indicators that assess a company's financial health. These financial ratios are calculated from items in the income statement or the balance sheet.
Financial ratios can be expressed as a number or a percentage.
When expressed as a number, a KPI can be stated in terms of:
- monetary value (e.g. € or $);
- time (e.g. days or hours);
- number of people;
- … .
When expressed as a percentage, a KPI can indicate:
- a change over time (e.g. revenue growth compared with the previous year);
- a proportion (e.g. the share of profit generated relative to an investment, in the case of ROI, Return On Investment).
 The different forms of KPI can work together within the same management report.
 🚀 Are you a start-up or scale-up?
💡 By tracking your KPIs, get a clear view of your current performance so you can set even more ambitious goals!
In this exclusive ebook, discover the KPIs to track to drive your growth.

The role of financial ratios
Financial ratios let you compare the state of a company's finances from one point in time to another. The resulting information is useful:
- internally (executive management, managers, teams…);
- externally (investors, management committee, banks…).
Analyzing financial ratios helps answer many questions. Here's a selection:
- Is my company more or less profitable than the competition? Is it in line with the industry average?
- What is the return on investment of my company's latest projects?
- Can my company pay its debts as they fall due? In other words, is it solvent?
- …
What types of ratios are there?
There are many financial ratios. They can, however, be grouped into 4 main categories:
- Activity: financial ratios designed to give an overall view of the company.
- Liquidity: ratios focused on how efficiently the company manages its cash.
- Solvency: ratios centered on the company's ability to repay its debts.
- Profitability: financial ratios geared toward assessing the company's financial performance.
 If your company is at an advanced stage of maturity, you may be familiar with market ratios. These are used by publicly listed companies.
How do you work with financial ratios?
Method
1. Identify the ratios to track
We recommend that our customers follow three simple steps to identify the ratios to track.- Refer to your business strategy.
- Set goals linked to that business strategy.
- Track the financial ratios that can measure whether those goals are being met.
Once you've identified your financial ratios, track how they evolve. This will give you a good idea of your progress toward your goals.

The three-step method for building dashboards based on financial ratios
2. Prepare the financial statement data
Make sure the data is available, accurate and compliant. To assess the reliability of your financial data, ask yourself the following questions.
- Is it based on the final, approved financial statements?
For companies subject to audits, this point is crucial. - Was it calculated in the same way?
This is especially important when comparing companies with one another. - Was it collected over the same period?
For a comparison of results to be valid, the data must be compared over the same period. This is particularly true for companies with strong seasonality, such as tourism businesses.
3. Calculate the financial ratios
Based on the financial ratios you've chosen to track, calculate those ratios. In this article, you'll find the formula for each of the ratios mentioned.
4. Interpret the financial ratios through reporting
Now for the most important step of all... Interpreting your financial ratios.
To carry out this step successfully, adopt a reporting tool that can help you track your financial ratios and their improvement.
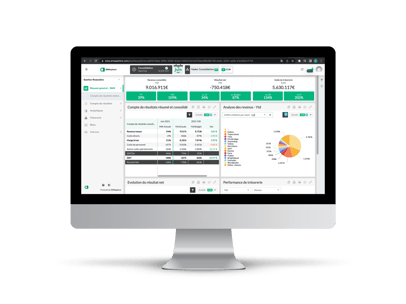
With EMASPHERE, the reporting tool lets you directly track the data obtained via the connection to your accounting software. This means you can interpret your financial ratios with greater accuracy. With EMASPHERE, you get:- a catalog of KPIs made up of the most widely analyzed financial indicators;
- and automatic updates of your financial ratios.
This matters, because your added value lies in interpreting the reporting, not in building it.
Here's how it works:

How information flows from business software
(accounting, logistics, CRM...) to EMASPHERE through connectors
Finally, cross-analyze several ratios rather than analyzing a single ratio on its own. A single ratio could be misleading.
Improve your company's performance
Based on the signals revealed by your financial ratio analysis, take steps to improve.
List your company's priorities and decide which actions to take to increase or maintain your company's performance.
 How do you know where to start?
There are several methods, but here's our favorite: the quick win. It involves ranking the actions to take according to two criteria.
- Their impact on your company's performance.
- How easy and/or quick they are to implement.
So tackle your topics starting with those that are easiest and quickest to implement, while still having an impact on company performance, and finish with those that are hardest to implement and least effective. This method aims to deliver improvements quickly.

Which financial ratios should you choose?
Choose your financial ratios carefully, in line with your company's specific needs.
To help you choose, we've drawn on our experience with our 10,000+ customer companies. Based on this experience, we've selected:
- the essential financial ratios;
- financial ratios linked to the analytical dimensions of management accounting.
The essential financial ratios
The following ratios can be analyzed over different periods, comparing one week, month or year with another.
For clarity, they are listed by type.
Liquidity ratios
Working capital requirement
The working capital requirement (WCR) represents the short-term financing needs arising from the operating cycle. In other words, the WCR is mainly made up of 3 items:
- trade receivables (operating current assets);
- inventory (operating current assets);
- trade payables (short-term operating liabilities).
Here's a common way to calculate it:

This financial KPI focuses on the funds your company has available. It tells you whether they are sufficient to finance your company's operations.
When the funds are higher, the (working capital) requirement is negative. This means the business generates enough resources to finance the company's operating cycle. Your company is therefore able to finance its activity on its own: it doesn't need external financing.
 Track your working capital requirement over one year, or even two. This will let you account for seasonal activities (e.g. restocking inventory, which affects the WCR).
Net financial position
The net financial position corresponds to the company's available cash (after deducting financial debt). This cash is intended to cover debts as they fall due. The net financial position is also known as net cash.
Here's how to calculate it:

The net financial position lets you assess the level of debt net of cash.
 Compare your company's net financial position with its cash balance. This will tell you whether your cash is sufficient to repay financial debt, for example.
7 mistakes to avoid for successful reporting
Every finance professional has made a reporting mistake at some point. Thanks to our more than 10,000 customer companies, we've been able to compile the most common mistakes for you.
Never make a mistake again by downloading this free ebook.

Profitability ratios
EBITDA
EBITDA stands for Earnings Before Interest, Taxes, Depreciation, and Amortization. It corresponds to operating profit before interest, taxes, depreciation and amortization charges. EBITDA is a financial KPI focused on profitability.
Here's how to calculate it:

EBITDA measures how profitable your company's operating process is. Its purpose is to identify the wealth your company creates. It can, for example, be used to compare your company with others.
 EBITDA doesn't take into account your financing or investment policies, or your tax constraints. It determines whether the company is profitable from its operations, but doesn't tell you whether it makes a net profit.
Gross margin
There is no standard definition of gross margin. Each industry has its own definition of this financial ratio.
In theory, gross margin is the difference, excluding tax, between the selling price and the cost of your goods and/or services. Gross margin tells you whether a company's activities, products or services are profitable. At a minimum, it must cover the company's fixed costs.
Here are different ways to calculate it, depending on the industry concerned.
Distribution sector:

Manufacturing sector:

Services sector:

Calculating gross margin shows you the margin level of your business relative to your total revenue.
 Compare your gross margin rate with that of your competitors (= gross margin/purchase costs excluding tax). Based on this comparison, you can take action. For example, you might decide to lower your selling price to gain market share without sacrificing profitability.
Activity ratios
Revenue
Revenue is probably the easiest financial ratio to grasp. It gives you an overall view of your business. Revenue is stated excluding VAT. It corresponds to the sales of goods and/or services made by your company.
Here's the calculation:
 Your revenue needs to be monitored closely. Changes in it are valuable sources of information. If revenue rises or falls over a given period, try to understand why. The reasons behind these fluctuations can guide your strategic decisions.
For example, you might decide to allocate more or fewer resources to a service or product during the period identified. It will also help you determine whether these variations coincide with changes such as:
- changes in the sales team;
- stockouts;
- … .
Gross margin
Personnel cost ratio
The personnel cost ratio shows how significant your personnel costs are relative to the revenue generated.
Here's how to calculate it:

 Ideally, this ratio should always be below 1. It varies depending on the size of your company's payroll. For a complete list of HR KPIs, selected by our in-house expert, read our article on HR dashboards.

As a CFO, how can you stop racing against the clock?
🤔
⏰Discover the 4 time optimization levers for CFOs in a free ebook.

Solvency ratios
Solvency ratio
The solvency ratio assesses your company's degree of financial independence.
If it's above 50%, your debts are covered by your equity. Your company is therefore (broadly) financially independent. The norm for this ratio is between 0.25 and 0.40. For a family business looking to maintain financial independence, this ratio tends to be higher.
It's calculated as follows:

The solvency ratio is watched particularly closely when a company applies for a loan, since it determines the company's ability to meet its repayments.
Repayment capacity
The repayment capacity ratio expresses the number of years of cash flow from operations (earnings) the company would need to devote to repaying its debts.
- Cash flow from operations = net profit + non-cash expenses;
- Non-cash expenses = depreciation and amortization + provisions for risks and charges;
- Net debt = bank debt + shareholder current accounts - cash.
Here's how to calculate it:
 Repayment capacity is also one of the key indicators for banks. Based on the value of this ratio, they can decide whether (or not) to grant a loan.
The standard value for repayment capacity is between 3 and 5 years. The only exception: sectors that require significant investment, such as real estate or construction.
Financial ratios to track with analytical dimensions
Profitability is at the heart of our customers' concerns. They track it through financial ratios, broken down by analytical dimensions. This dual analysis gives them, for example, a precise understanding of their profitability by:
- project or product;
- business unit;
- region.
Note: Depending on your organization's needs, these ratios can be tracked monthly and/or annually.
Choose the appropriate analytical dimensions based on your own business model. For example, a cosmetics manufacturer could benefit from a Month-to-date (MtD) profitability ratio applied to the product or product range dimension.

Make the most of your financial ratios
After this close look at financial ratios, you're now equipped to put them to the best possible use.
Once you've selected your financial ratios, all that's left is to track them with management reporting.
- Designed by a CFO for CFOs, EMASPHERE offers a reporting solution tailored to your challenges. Join our community of 10,000+ customer companies and benefit from tailor-made features too.
- A catalog of 50+ financial KPIs, the ability to create your own indicators, and a drill-down feature to access the detail behind your figures from any screen.
- Schedulable alert thresholds, configurable to your needs so you're notified whenever necessary.
- Information sharing, made easy with schedulable reports and access that can be customized for each user (level of responsibility, user needs...).

Download our free ebook: "How do you build a dashboard?"





Rather talk it through with a human?
A first conversation, with no commitment, to see what your reporting could become.